Electric Load Prediction
A competition for accurate prediction of produced electrical power and required load for determining the residual power demand.

At a Glance
As part of a competition organized by Städtische Werke AG in Kassel, the House of Energy e.V. and hessian.ai, Qnovi GmbH developed an efficient and precise system to forecast the residual electricity demand of a municipal maintenance facility for the next day.This required two models: one to predict the electrical output of the in-house solar array and another to forecast on-site consumption. While the generated solar power is primarily influenced by the weather, consumption forecasting is dominated by operational workflows and human factors. For example, the system can accurately reflect the impact of bridge days (long weekends) or strike announcements on the facility’s required electrical power.
From the model predictions, it is possible to derive how much residual energy the energy supply company (EVU) must provide to the customer in the next 24 hours distributed over 15-minute intervals. This forecast can be used by the power supply company to make more targeted purchases on the EPEX day-ahead market.

Icons created by Freepik , Smashicons, Eucalyp - Flaticon
Background

An important part of the energy transition is the expansion of decentralized renewable energy sources. A large area of use in this context are systems for generating in-house electricity via photovoltaic modules on industrial and commercial properties. The electricity generated is primarily consumed by the customers themselves. Additional capacities are purchased if the required quantities are not sufficient. If too much electricity is generated, it is fed into the power grid and sold. The resulting residual load (residual load = energy demand - self-generated energy) must be provided by the energy supplier.
To ensure a stable energy supply, energy providers rely on forecasts of residual loads. In the past, these residual loads could be forecast based on many years of experience and statistics. Now, the amount of solar installations, and thus the amount of self-generated electricity, continues to increase. This makes forecasting residual loads more and more complex, as there are additional dependencies on external factors such as weather. However, forecasting the residual power demand is necessary to maintain a safe and proper power supply operation.
Our Procedure
Data Analysis - Load

First, an intensive data investigation and preparation was carried out. Among other things, two issues were noticed with the load. During the time changeover, there were duplicate and inconsistent data lines, and at the same time the load value was 0. In addition, there also seems to have been a load drop on 09.05.2020 at 19:30. Since there usually was a base load and loads of 0 kW differ significantly from this base load, these values were marked as outliers, removed and the adjacent values were interpolated. Otherwise, there could have been a strong influence on the later forecasts.
In order to investigate in more detail which input data are useful at all for later modeling, further analyses were performed. In general, the electric load is strongly dependent on seasonality. For example, electricity consumption in winter differs significantly from that in summer. Thus, the seasonal differences of spring, summer, fall and winter must be represented by the model. This is done by categorizing the respective year into different sections. Since this is not the general load, but the load of a specific company, other factors play a role. These include, for example, the start of work, break times, different vacation periods or the general capacity utilization of the facility. Similarly, there are also strong differences between the weekend and the working week. During the working week, both the base load and the peak load of operations are significantly higher. Public holidays and strikes have a similar influence.

Influence of Weekend and Temperature
Both the day of the week and the ambient temperature had a strong influence on the electrical load.

Influence of the Lockdown
Since the building is a public transportation maintenance facility, the lockdown had little impact.
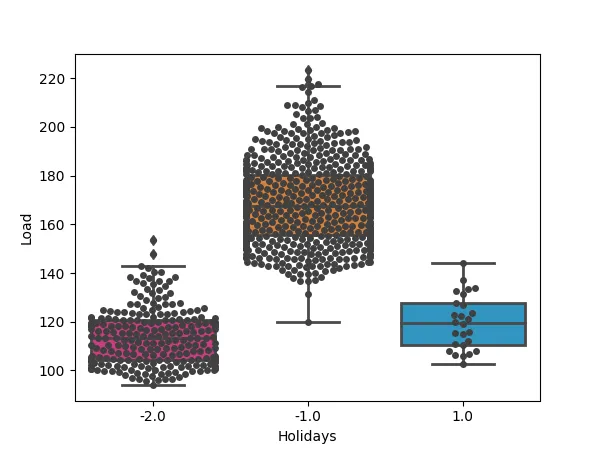
Influence of Public Holidays
The influence of holidays (1.0) shows significant differences from normal working days (-1.0) and is on par with weekends (-2.0) in terms of consumption.
Data Analysis - Solar Power

Scatter of the Produced Electric Power
The produced electrical power scattered relatively strongly above the radiation, which required a high compensation. In addition, there were isolated outliers that did not correlate with the radiation.

Partial Collapse of the Electrical Power
Especially from the back part of the diagram it became clear that further possibly local effects had a strong influence on the photovoltaic power, which were not captured by the radiation measurement.
In principle, it would have been possible to estimate the power produced by the photovoltaic system by means of physical modeling based on the radiation data and the efficiency. However, it turned out that this would have required compensation for the temperature effect on the efficiency. This can be seen well in the relatively wide band of produced power. In addition, there are partial sections where the produced power did not correlate with the incoming radiation. The drop in the radiation signal seems to precede or follow in these areas, but no reason for this can be determined from the data. Thus, local effects could also play a role, for example partial covering of the photovoltaic modules by shadows.
Feature Engineering
In order to be able to use the investigations described above also for the later training of the neural networks or generally of the machine learning algorithms, the appropriate features had to be generated. Public holidays are listed in the Python library holidays. Furthermore, additional, non-statutory holidays such as Christmas Eve or New Year's Eve were entered.
Further investigations showed that several strikes took place during the periods. Since strikes - especially in the public sector - are usually announced, this feature can also be used during the later application of the algorithm.
Furthermore, input features had to be created so that the algorithm learns the seasonality and does not just overfit to the date. For this purpose, additional columns were created for the week, the month and the year.
import holidays
holidays.Germany(
  years=[2018, 2019, 2020],
  subdiv="HE"
)
Public Holidays
The public holidays can be loaded relatively easily via the Python library holidays. The advantage is that holidays of different federal states can be defined automatically.

Other Non-Official Holidays
In addition to official holidays such as Christmas Day, there are other regional holidays. These have a comparable influence to official public holidays and have therefore been marked as such.
for day in holidays:
    if day == "Tuesday") and „day-1 not a holiday":
        return Brueckentag
    if day == "Thursday") and not „day+1 not a holiday":
        return Brueckentag
Bridge Days
During the training of the algorithms, it became apparent that further problem points occurred especially around the public holidays. These can be defined with the help of bridge days.

Seasonality
In order to learn the seasonality, the year, month, week and other information was extracted from the actual date. If only the date was used as input parameter, the ML algorithm usually does not learn seasonality and overfits easier.

Rain Data
During the training, it became apparent that additional weather data such as the rain data from the German Meteorological Service (DWD) led to an improvement in the forecast accuracy. For this purpose, the data was downloaded from the DWD and adapted to the data set. The use of radar data did not prove useful due to the unknown location of the facility.
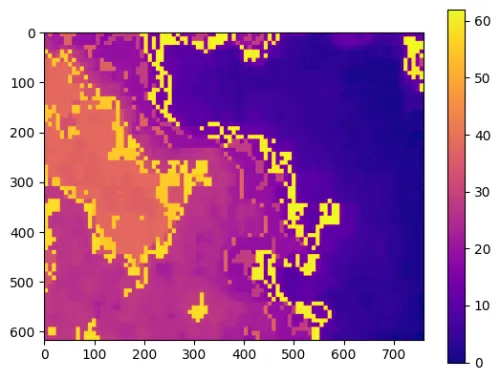
Rain Radar
It was also investigated whether further information could be used based on weather radar data. Initial investigations were not promising due to the unknown location, so this avenue was not pursued further. However, if the location is known, either local weather phenomena can be extracted or the radar data can be used directly for training.
Basically, no further features are needed for the power prediction of the photovoltaic system. Both the direct and indirect radiation as well as other data such as the ambient temperature should be sufficient for the modeling. However, it became apparent during the data analysis that the variance was relatively high in some cases and several outliers were present. On the one hand, this can be attributed to the influence of the temperature and the dirt level on the efficiency of the solar cells, but also to local effects such as the partial covering of the solar cells by clouds or snow.
Data Splitting and Slicing
The data provided consists of two csv files, the training and test data. In total, these cover a period of approximately 3 years between January 2018 and October 2020. From this total period, contiguous periods of varying length are present within the training data. This is followed by a period of about one week with test data, which was used for monitoring the prediction accuracy. In between, a short period is missing to prevent simple interpolation.
Since neural network training usually requires a validation dataset, this had to be created first. The last week of the training data set was used for this purpose, as it is relatively similar to the subsequent test data. With the help of the validation data set, a possible overfitting can be identified and it is used to gradually reduce the learning rate during the training.
The neural network for predicting the power consumption within the company was trained exclusively with data supplied on a daily basis. The neural network for the prediction of the produced electrical power was trained both on a daily basis and on a tabular basis or directly on the basis of the transmitted data. Thus, for the training, daily blocks were generated in another preprocessing step.

Neural Network Training
As in many other customer projects, we used the Python library Tensorflow for neural network training. For this, we had decided to use an LSTM for load prediction due to the strong time dependency. For the prediction of the photovoltaic power, a hybrid approach was chosen. Due to the physical correlations in the input data, there should be no time dependence there. Nevertheless, a better prediction accuracy was partially shown with LSTM cells, which was due to the problems described above, where the incoming radiation did not correlate with the produced electrical energy. Such local effects can be partially covered by LSTM cells.

Load Prediction
A recurrent network with LSTM cells was used to predict the load. The advantage of these cells is that they can store time-related information and use it for the prediction.

Photovoltaic Power Prediction
For the prediction of the power generated by the photovoltaic system, a hybrid approach was chosen.

To further increase the prediction accuracy, a so-called ensemble learning was used. Here, predictions from different models are used and averaged. The benefit is that a better prediction accuracy can be achieved.
Validation
Due to the relatively limited data set, the internal evaluation of the algorithm was performed using the validation data set. For this purpose, both the RMSE, which was also used for the final evaluation, and other evaluation parameters such as the MSE or MAE were calculated.
The final evaluation in the competition was done via the Kaggle platform using input data whose associated load and performance were not known to the competition participants or to us.
Implementation
- Python
- C++
- C
- Swift
- Android (Java)
- Javascript
- ...
The implementation of neural networks or models was not part of the challenge, nevertheless some possibilities are shown below.
Since the Tensorflow library was used for training the networks, all available interfaces of this framework can be used.
Thus, a direct execution on the control unit, microcontroller or cell phone with iOS or Android can be realized. In addition, it can also be used directly in the browser via Javascript or alternatively via an API with an active Internet connection.